How to Practice Data Visualization with Community Challenges
Hi there! Welcome to my very first blog post — I’m thrilled you decided to click!
For this first post, I decided to write about something that has helped me a lot since I started digging into the data visualization world: the amazing data viz challenges created by the #DataFam community.
Honestly, it took me way too long to realize these challenges even existed! So I’m hoping this post can make your life a little easier 😊.
What Are Data Visualization Challenges?
Data visualization challenges are organized, community-driven initiatives where participants are given a dataset and/or a specific topic or theme to explore. The goal is to practice and improve skills by creating a unique chart, application, or dashboard from the same data and sharing the results online.
Why Should You Engage?
These challenges are our best friends for practice. They offer a structured, no-pressure way to sharpen three core skills:
- Data Manipulation: Cleaning and preparing raw data
- Exploratory Data Analysis (EDA): Finding the story within the data
- Visualization: Bringing that story to life with effective design
But for me, the real magic lies in the community aspect. Engaging in these challenges means you get to learn from others in two powerful ways:
- Inspiration: Seeing the diverse and creative ways people approach the same dataset
- Education: Studying their code and techniques to elevate your own skills
So now that you know what data viz challenges are and why they’re so valuable, the next question is: where do you find them?
Below are some of the most popular and beginner-friendly data visualization challenges created by the data community.
Popular DataViz Challenges
TidyTuesday
About: A data visualization challenge organized by the Data Science Learning Community. Each Tuesday, a new dataset is released, inviting participants to explore, analyze, and visualize the data in their own way
Period: Weekly (year round)
Focus Area: Data wrangling, analysis, visualization
Share Your Work: #TidyTuesday
Challenge Page: TidyTuesday GitHub Repository
30DayChartChallenge
About: A month-long data visualization challenge. Participants create one visualization per day based on a predefined theme (such as comparisons, distributions, or part-to-whole relationships), choosing their own data and tools
Period: April (month-long)
Focus Area: Visualization design, creativity, chart types, storytelling
Share Your Work: #30DayChartChallenge
Challenge Page: 30 Day Chart Challenge GitHub Repository
30DayMapChallenge
About: A month-long cartography and mapping challenge. Participants create one map per day based on a predefined theme (such as spatial patterns, distributions, or geographic storytelling), using their own datasets and tools
Period: November (month-long)
Focus Area: Mapping, spatial visualization, creativity, storytelling
Share Your Work: #30DayMapChallenge
Challenge Page: 30 Day Map Challenge GitHub Repository
MakeoverMonday
About: A weekly data visualization challenge where participants take an existing chart and redesign it to improve clarity, aesthetics, or insight. Each Monday a new challenge is released and participants are encouraged to explore data storytelling and chart improvement techniques
Period: Weekly (year round)
Focus Area: Data analysis, visualization improvement, storytelling, design critique
Share Your Work: #MakeoverMonday
Challenge Page: MakeoverMonday Website
SportsVizSunday
About: A challenge centered around sports data visualization. Participants create charts, infographics, or dashboards using sports-related datasets to explore trends, statistics, and storytelling opportunities in sports
Period: Weekly (typically on Sundays)
Focus Area: Sports analytics, visualization, storytelling, trend analysis
Share Your Work: #SportsVizSunday
Challenge Page: SportsVizSunday Website
GameNightViz
About: Data viz challenge on board games, video games, and gaming-related data. Each edition provides datasets at multiple skill levels and emphasizes both data preparation and visualization
Period: Monthly (one theme per month)
Focus Area: Gaming data, creativity, visualization, storytelling
Share Your Work: #GameNightViz
Challenge Page: GameNightViz Website
Making Your Practice Visible
Practicing data visualization doesn’t have to be a solo journey. Sharing your work is a powerful way to learn, connect, and grow.
You can start by posting your visualizations on social media using challenge-specific hashtags like #TidyTuesday, #MakeoverMonday, or #DataViz. Platforms like LinkedIn and X (Twitter) are full of people who enjoy seeing how others explore the same data and often give thoughtful feedback.
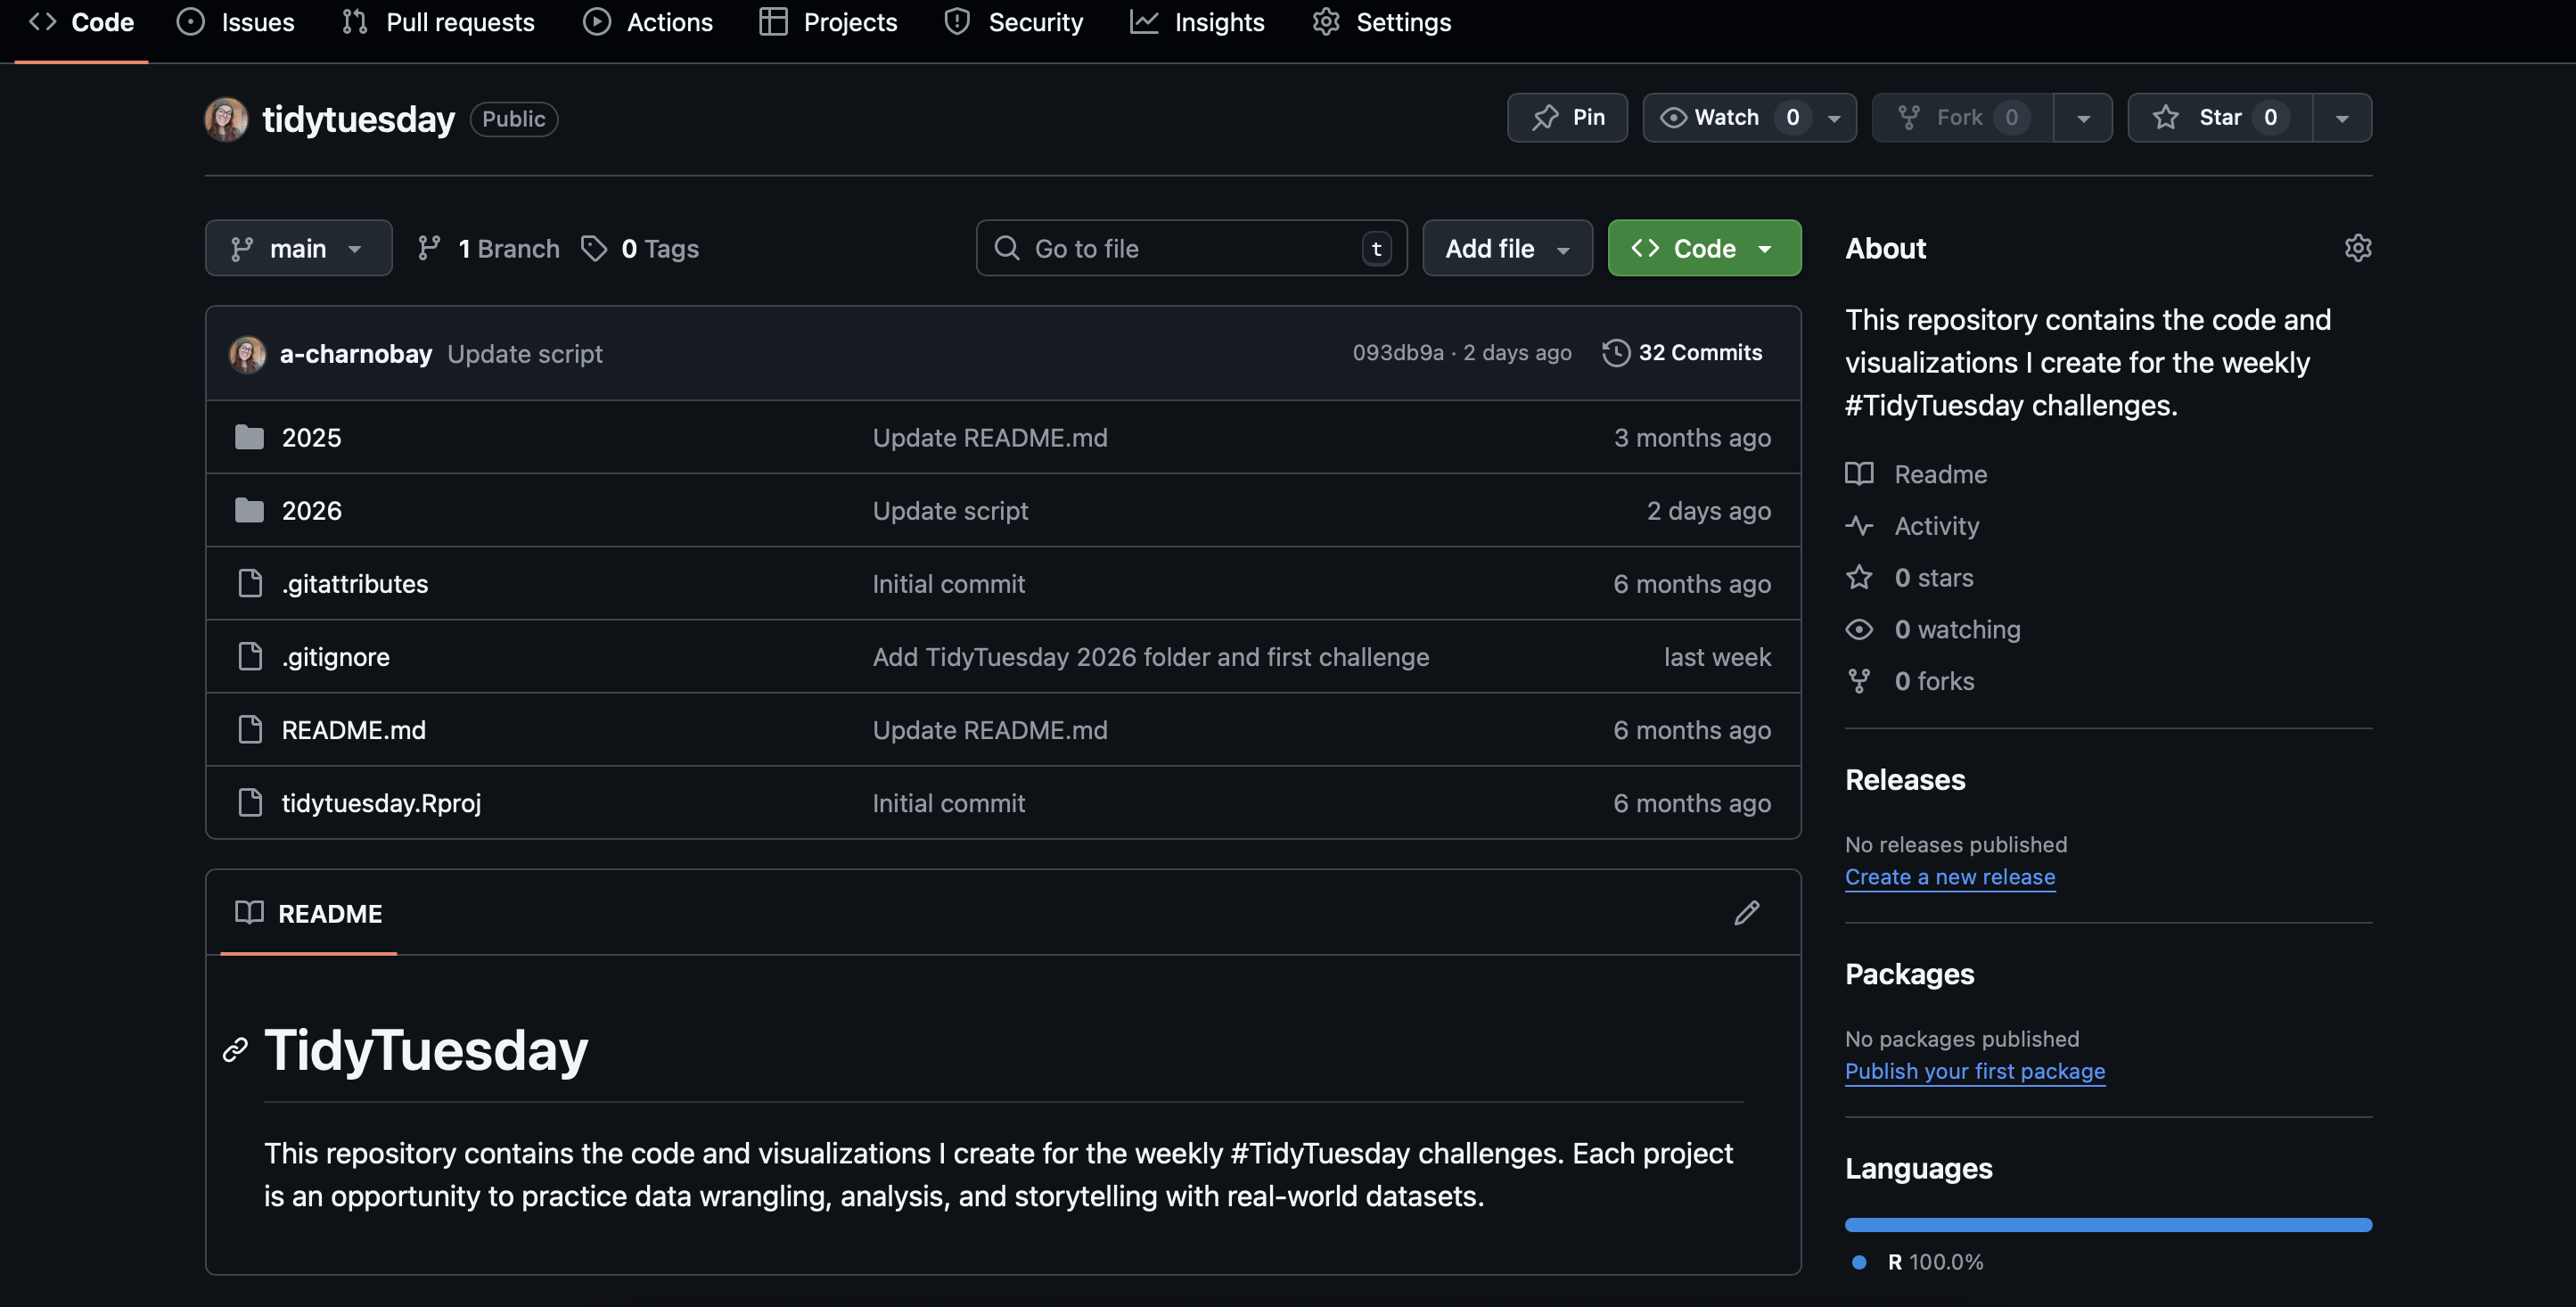
It’s also worth organizing your projects on GitHub. Creating a repository with your code, data source, and a short explanation of your process turns each challenge into an open portfolio. It shows not just the final chart, but how you got there.
It might feel intimidating at first, but the data community is genuinely kind and supportive. Sharing your work is less about being perfect and more about learning together.
Final Thoughts
If you’re just getting started with data visualization, these challenges are a fun and low-pressure way to practice consistently, try new techniques, and improve your data skills. Each challenge gives you a chance to learn from others, explore different datasets and tools, and get creative.
The best part is that there are challenges for every schedule and interest! You can join a weekly, monthly, or themed challenge, or bring your own data and practice analysis in the area you care about. Most importantly, it’s about community! Sharing your work, seeing what others create, and learning together.